Your Profit and Loss report shows how your firm performed over a period of time. It adds up everything you earned, subtracts everything it cost to run the firm, and shows the bottom line: your profit or your loss.
Open your Profit and Loss
- Log in to your workspace.
- In the left menu, under Finance, click Your Accounts.
- In the accounting menu, under Bookkeeping, click Profit & loss.
Note
If you see a message that your books are not set up yet, turn on your books first by clicking Set up your books.
Choose the period
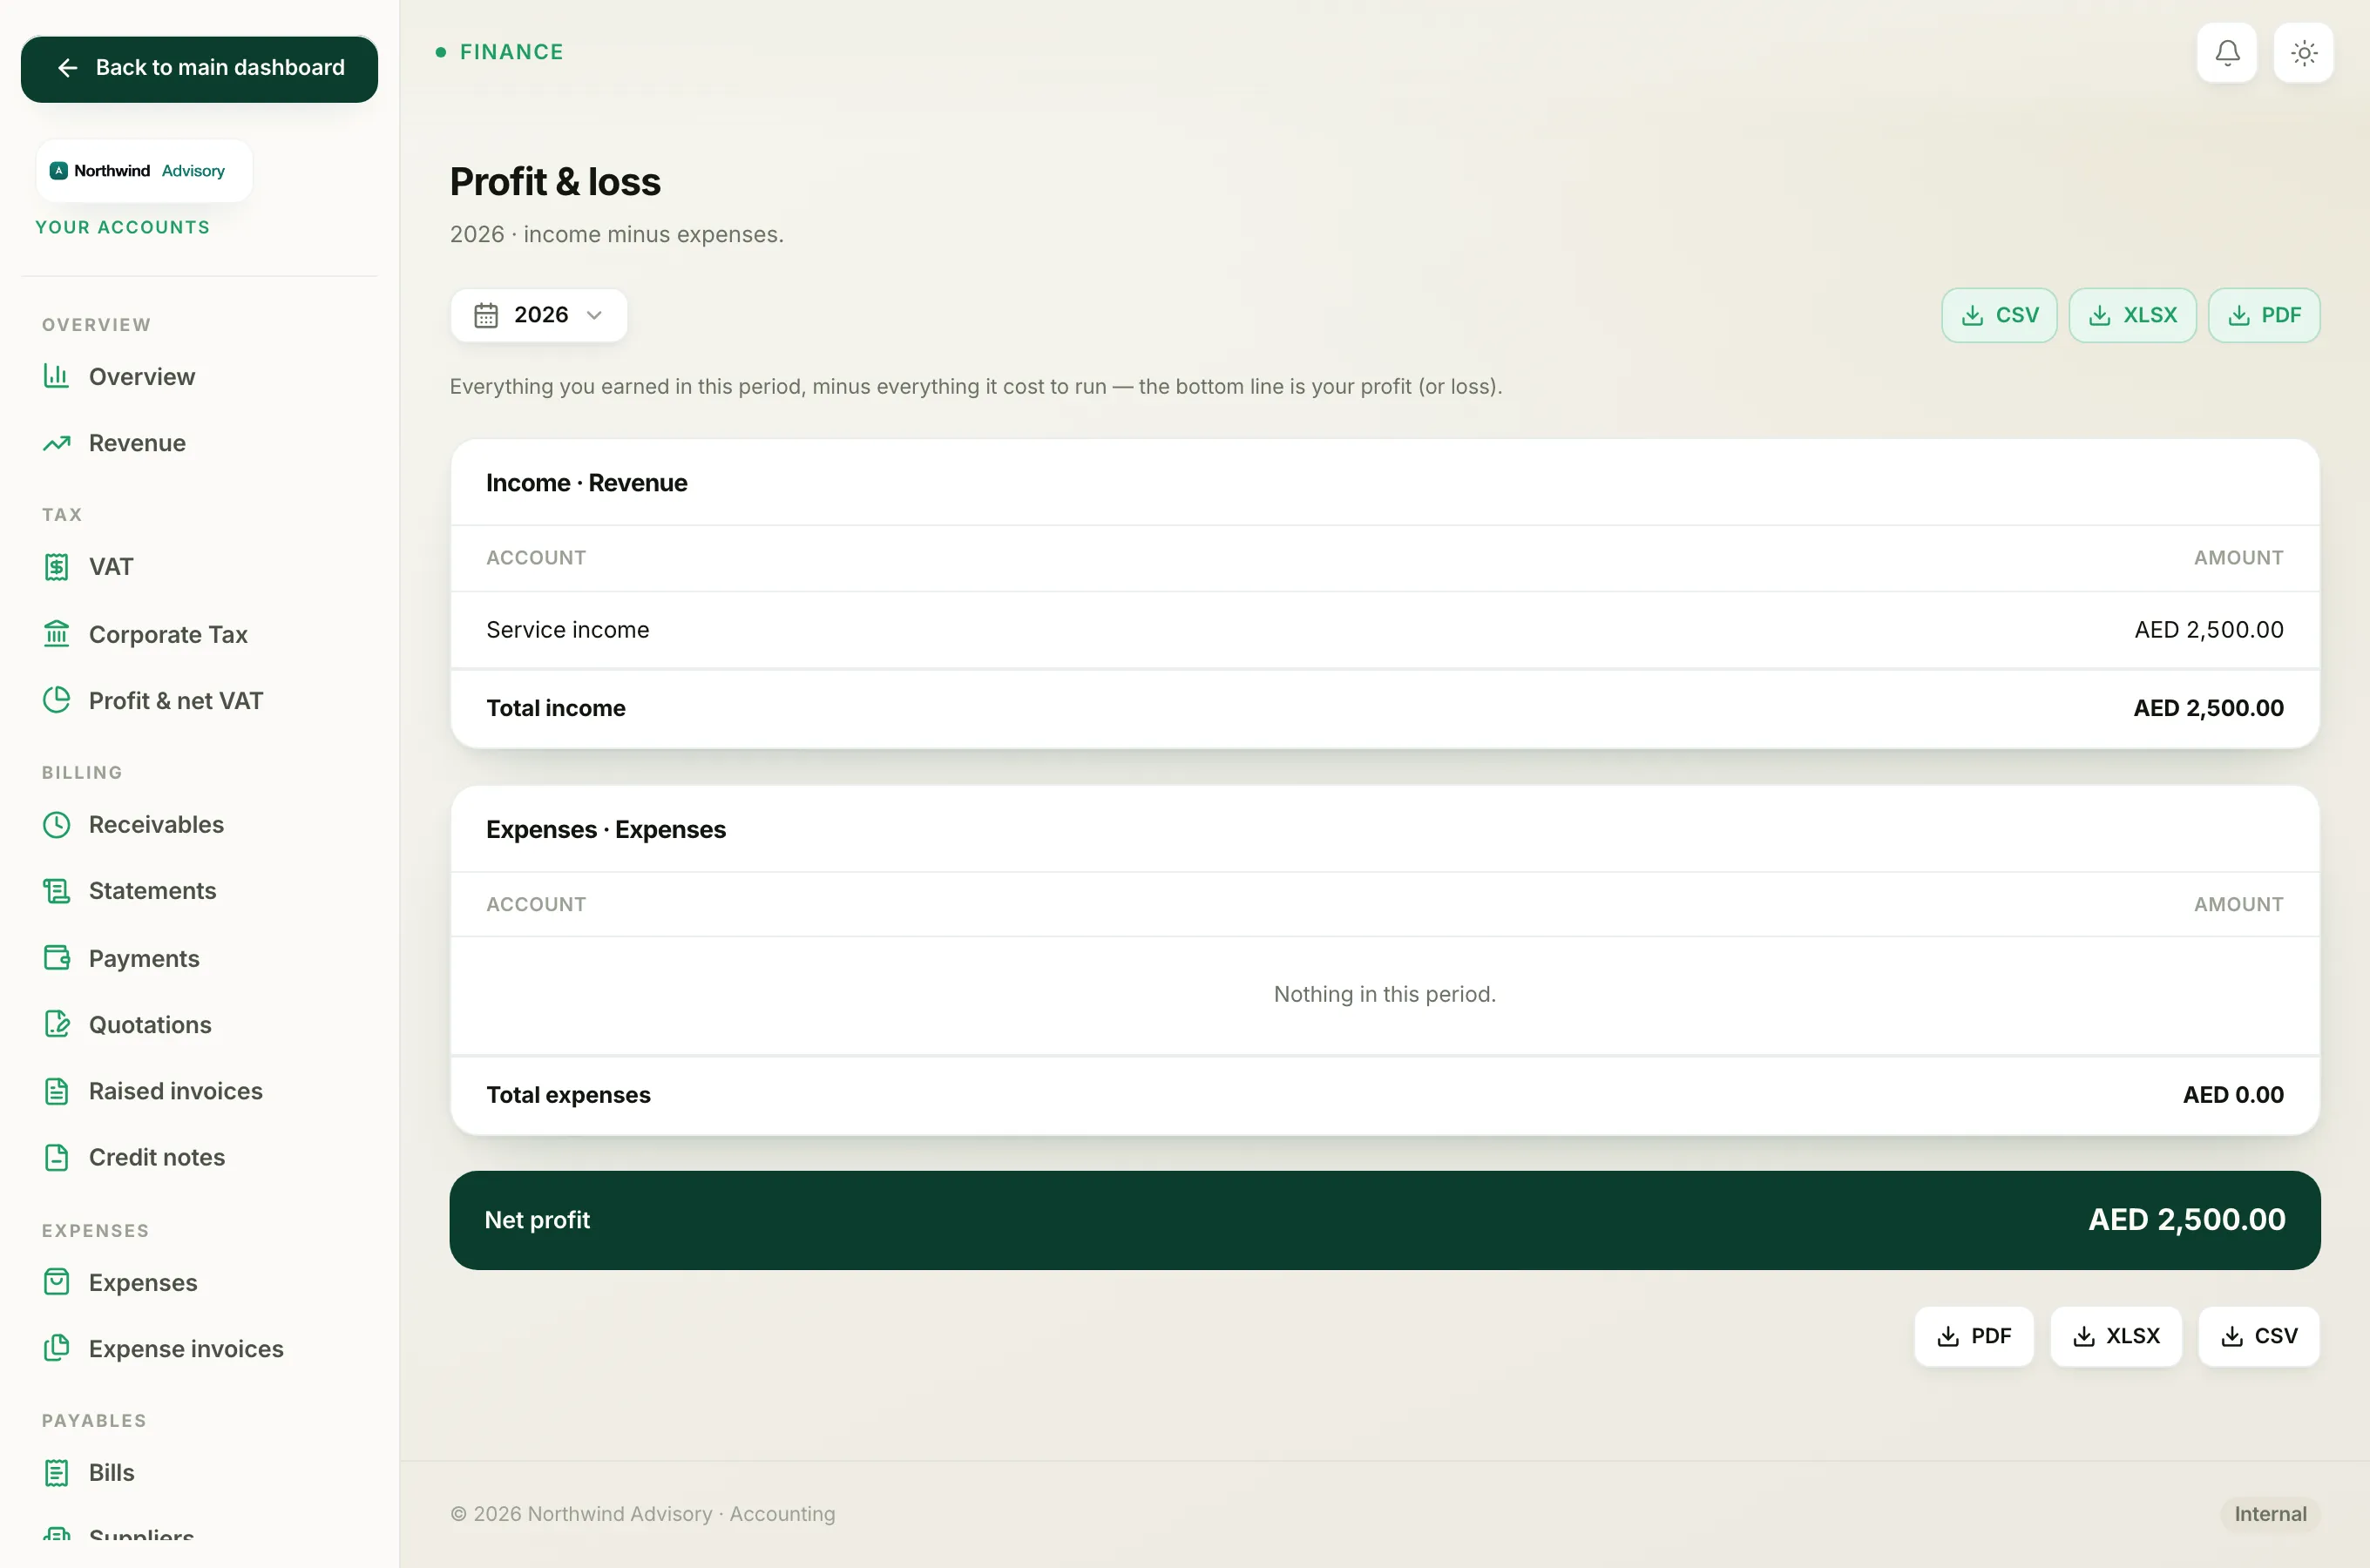
At the top of the report is a filter bar. Use it to set the stretch of time the report covers, for example this month, this quarter, or a custom range using the from and to dates. The heading updates to show the period you picked.
Tip
Profit and Loss always covers a period, not a single day. Compare the same length of time, for example one quarter against the quarter before, to see how you are trending.
How to read it
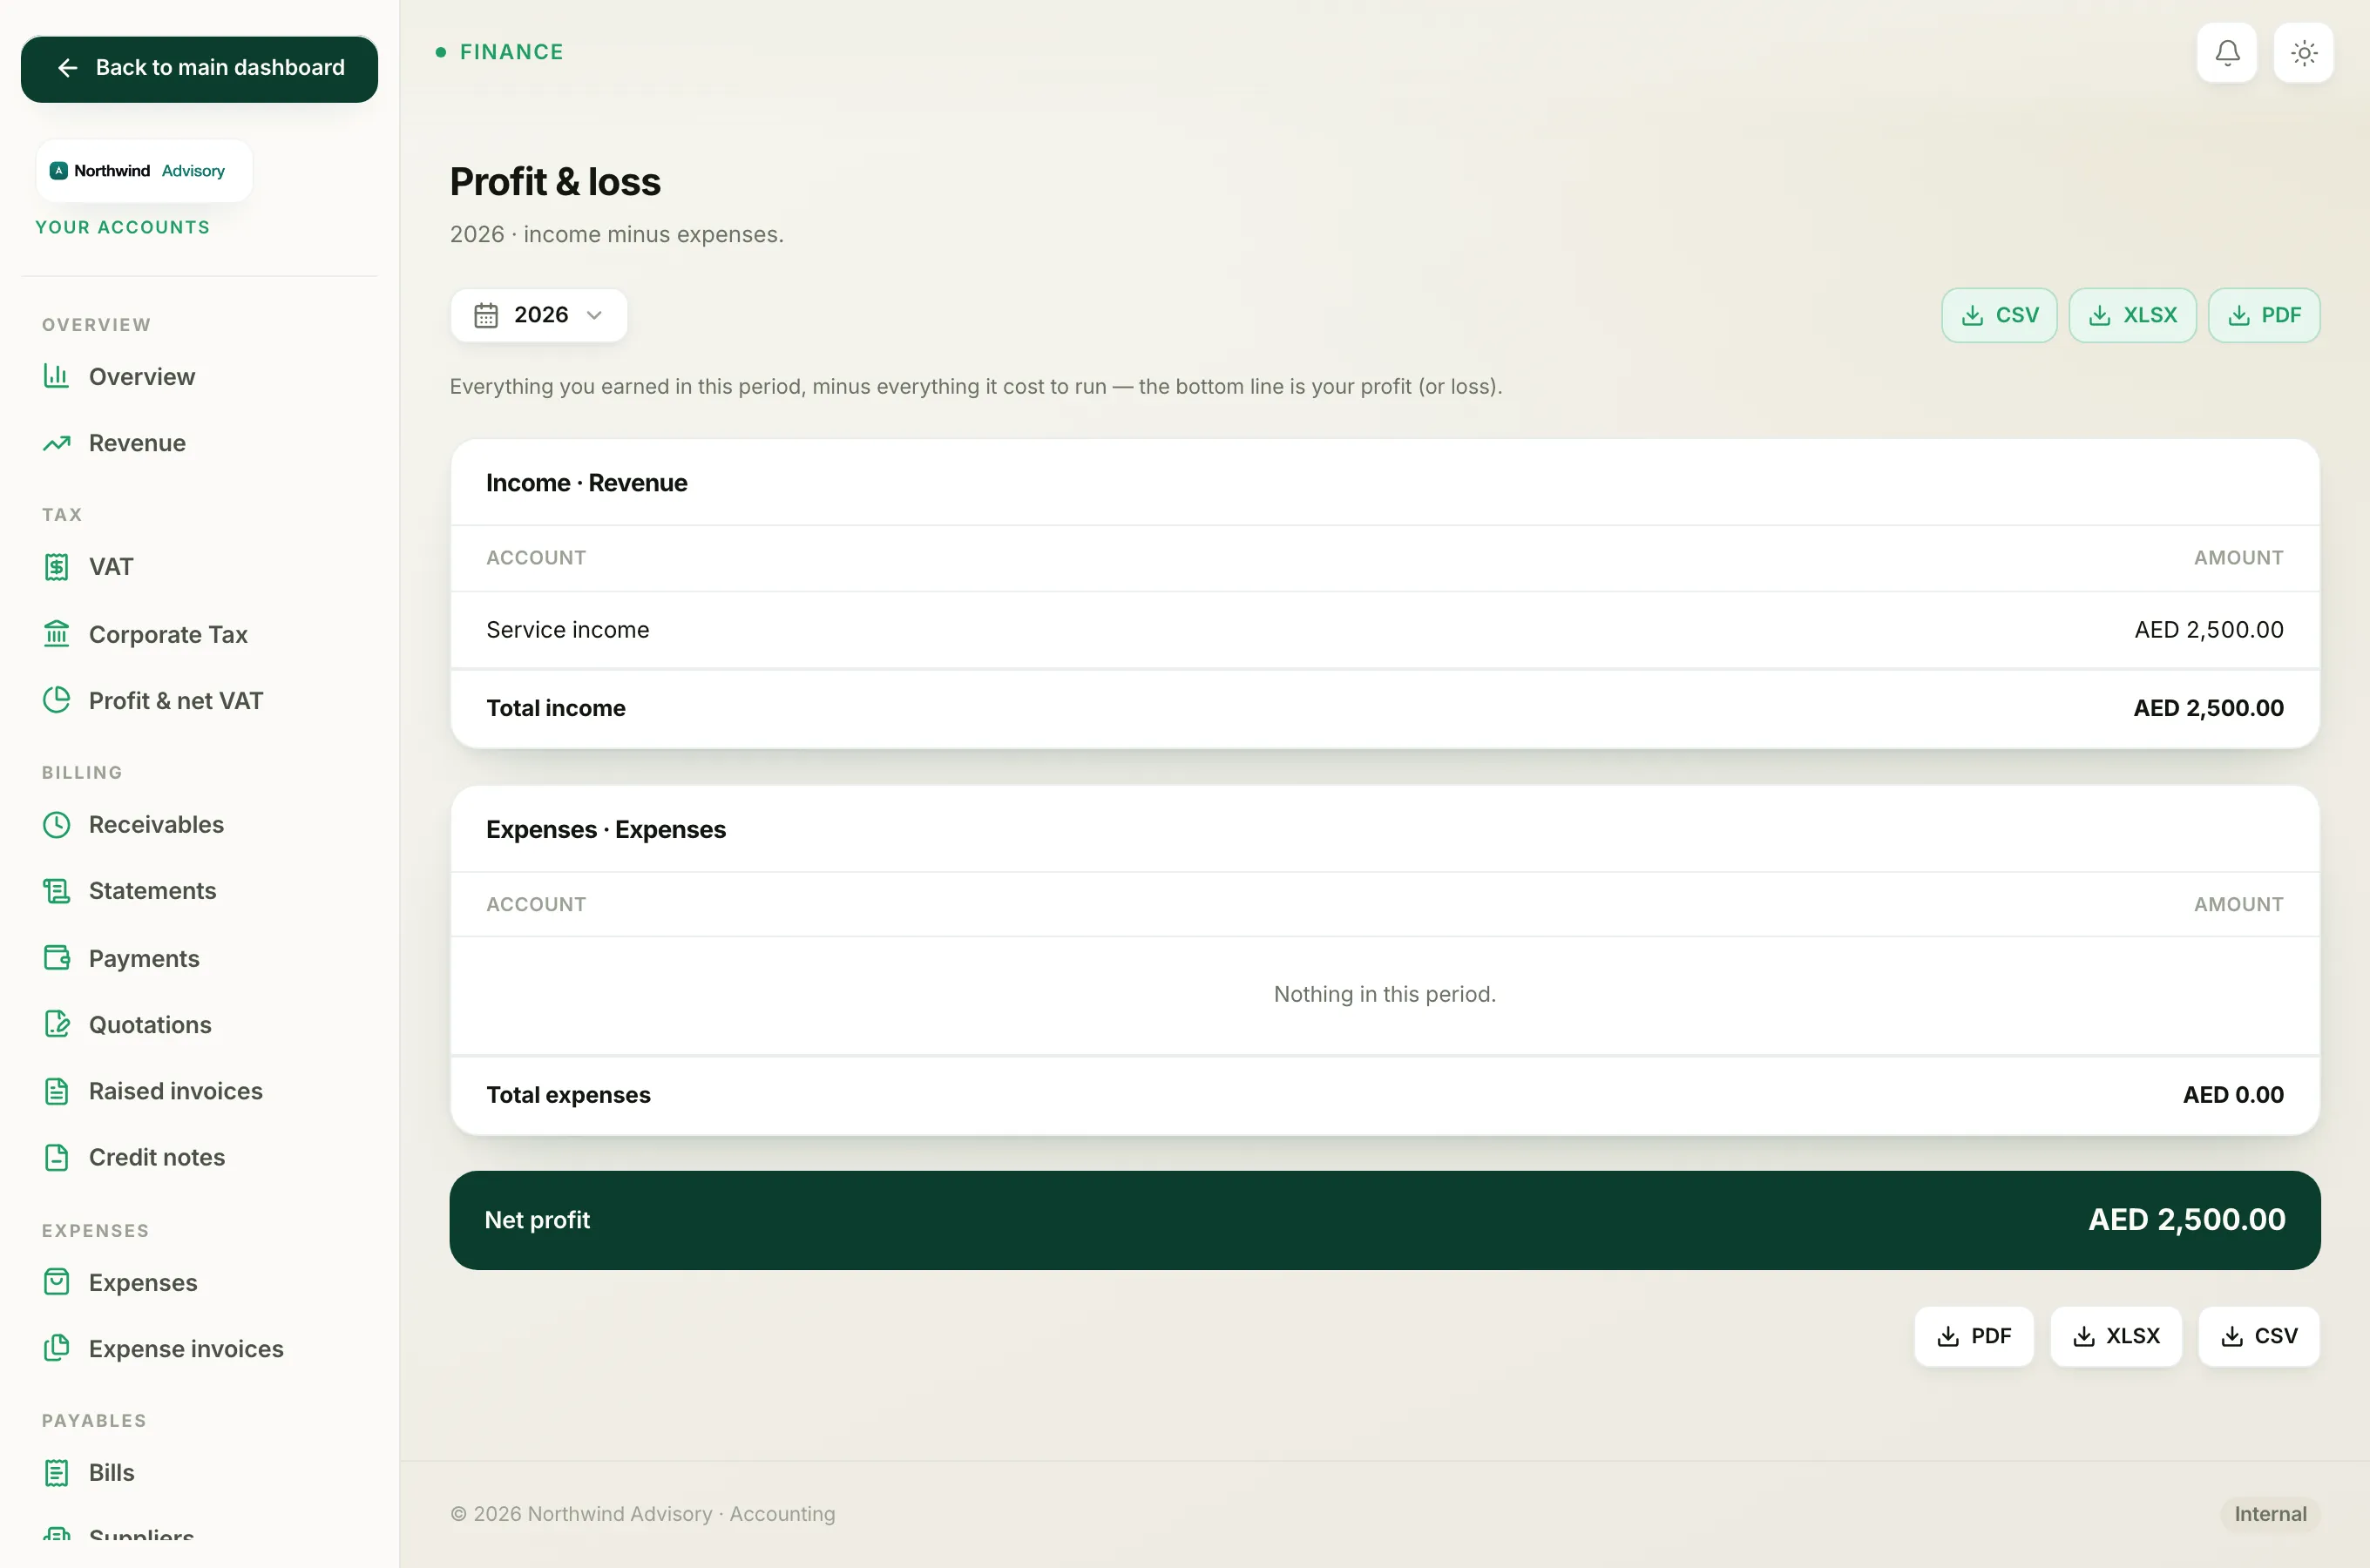
The report is built from two sections:
- Income. Every account where your firm earned money in the period, with a total at the bottom.
- Expenses. Every account where money was spent running the firm, with a total at the bottom.
Below the two sections is a single coloured bar with your result:
- A green Net profit bar means you earned more than you spent in the period.
- A red Net loss bar means you spent more than you earned.
The figure on the bar is your income total minus your expense total.
Save or share a copy
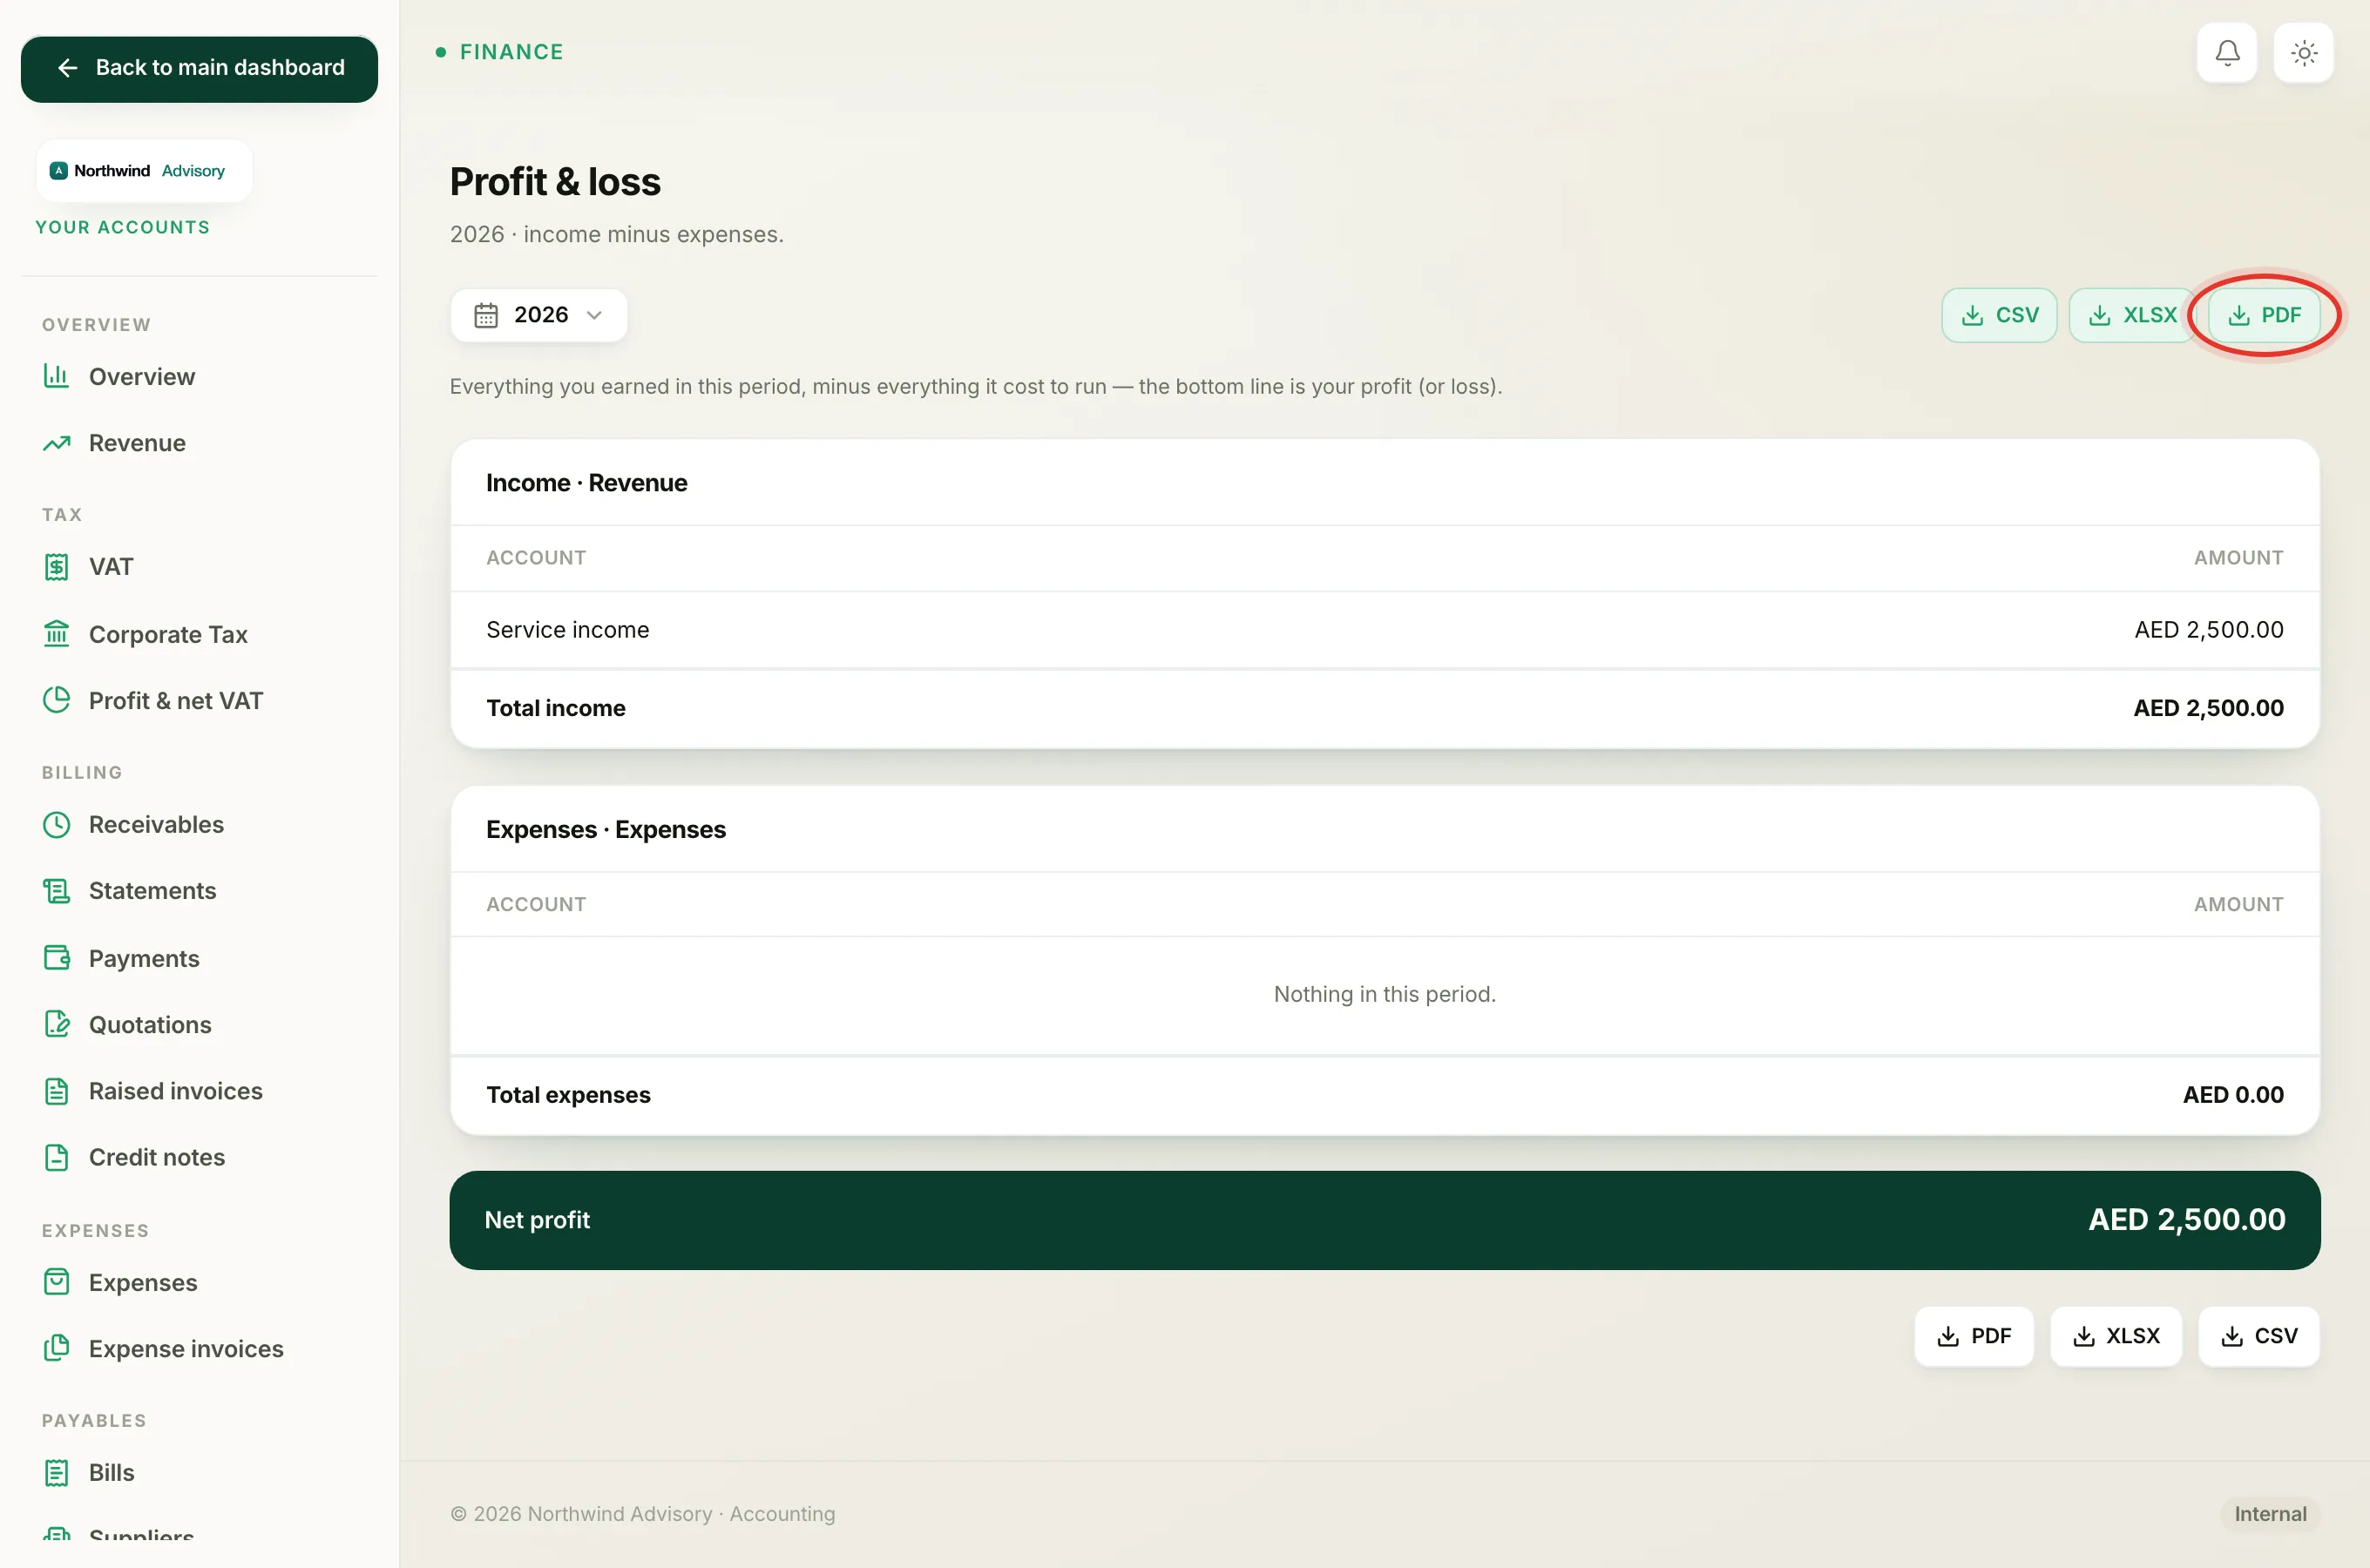
At the bottom right there are three download buttons: PDF, XLSX, and CSV.
- Click PDF for a copy to print or send.
- Click XLSX to open it in a spreadsheet.
- Click CSV for a plain data file to hand to your accountant.
Where the numbers come from
Every figure here is built automatically from the income and expense accounts in your Chart of accounts. When you create an invoice or record a supplier bill, it flows through to this report on its own. To see what the firm owns and owes rather than how it performed, look at your Balance Sheet.