The Profit & net VAT report answers two questions at a glance. How much VAT do I owe the FTA for this period, and did I make a profit? Every figure is worked out by the system from your invoices and recorded expenses, so you do not have to add anything up by hand.
Note
The whole Your Accounts area is only visible to staff with the Admin role. If a teammate cannot see it in their menu, that is why.
Open the report
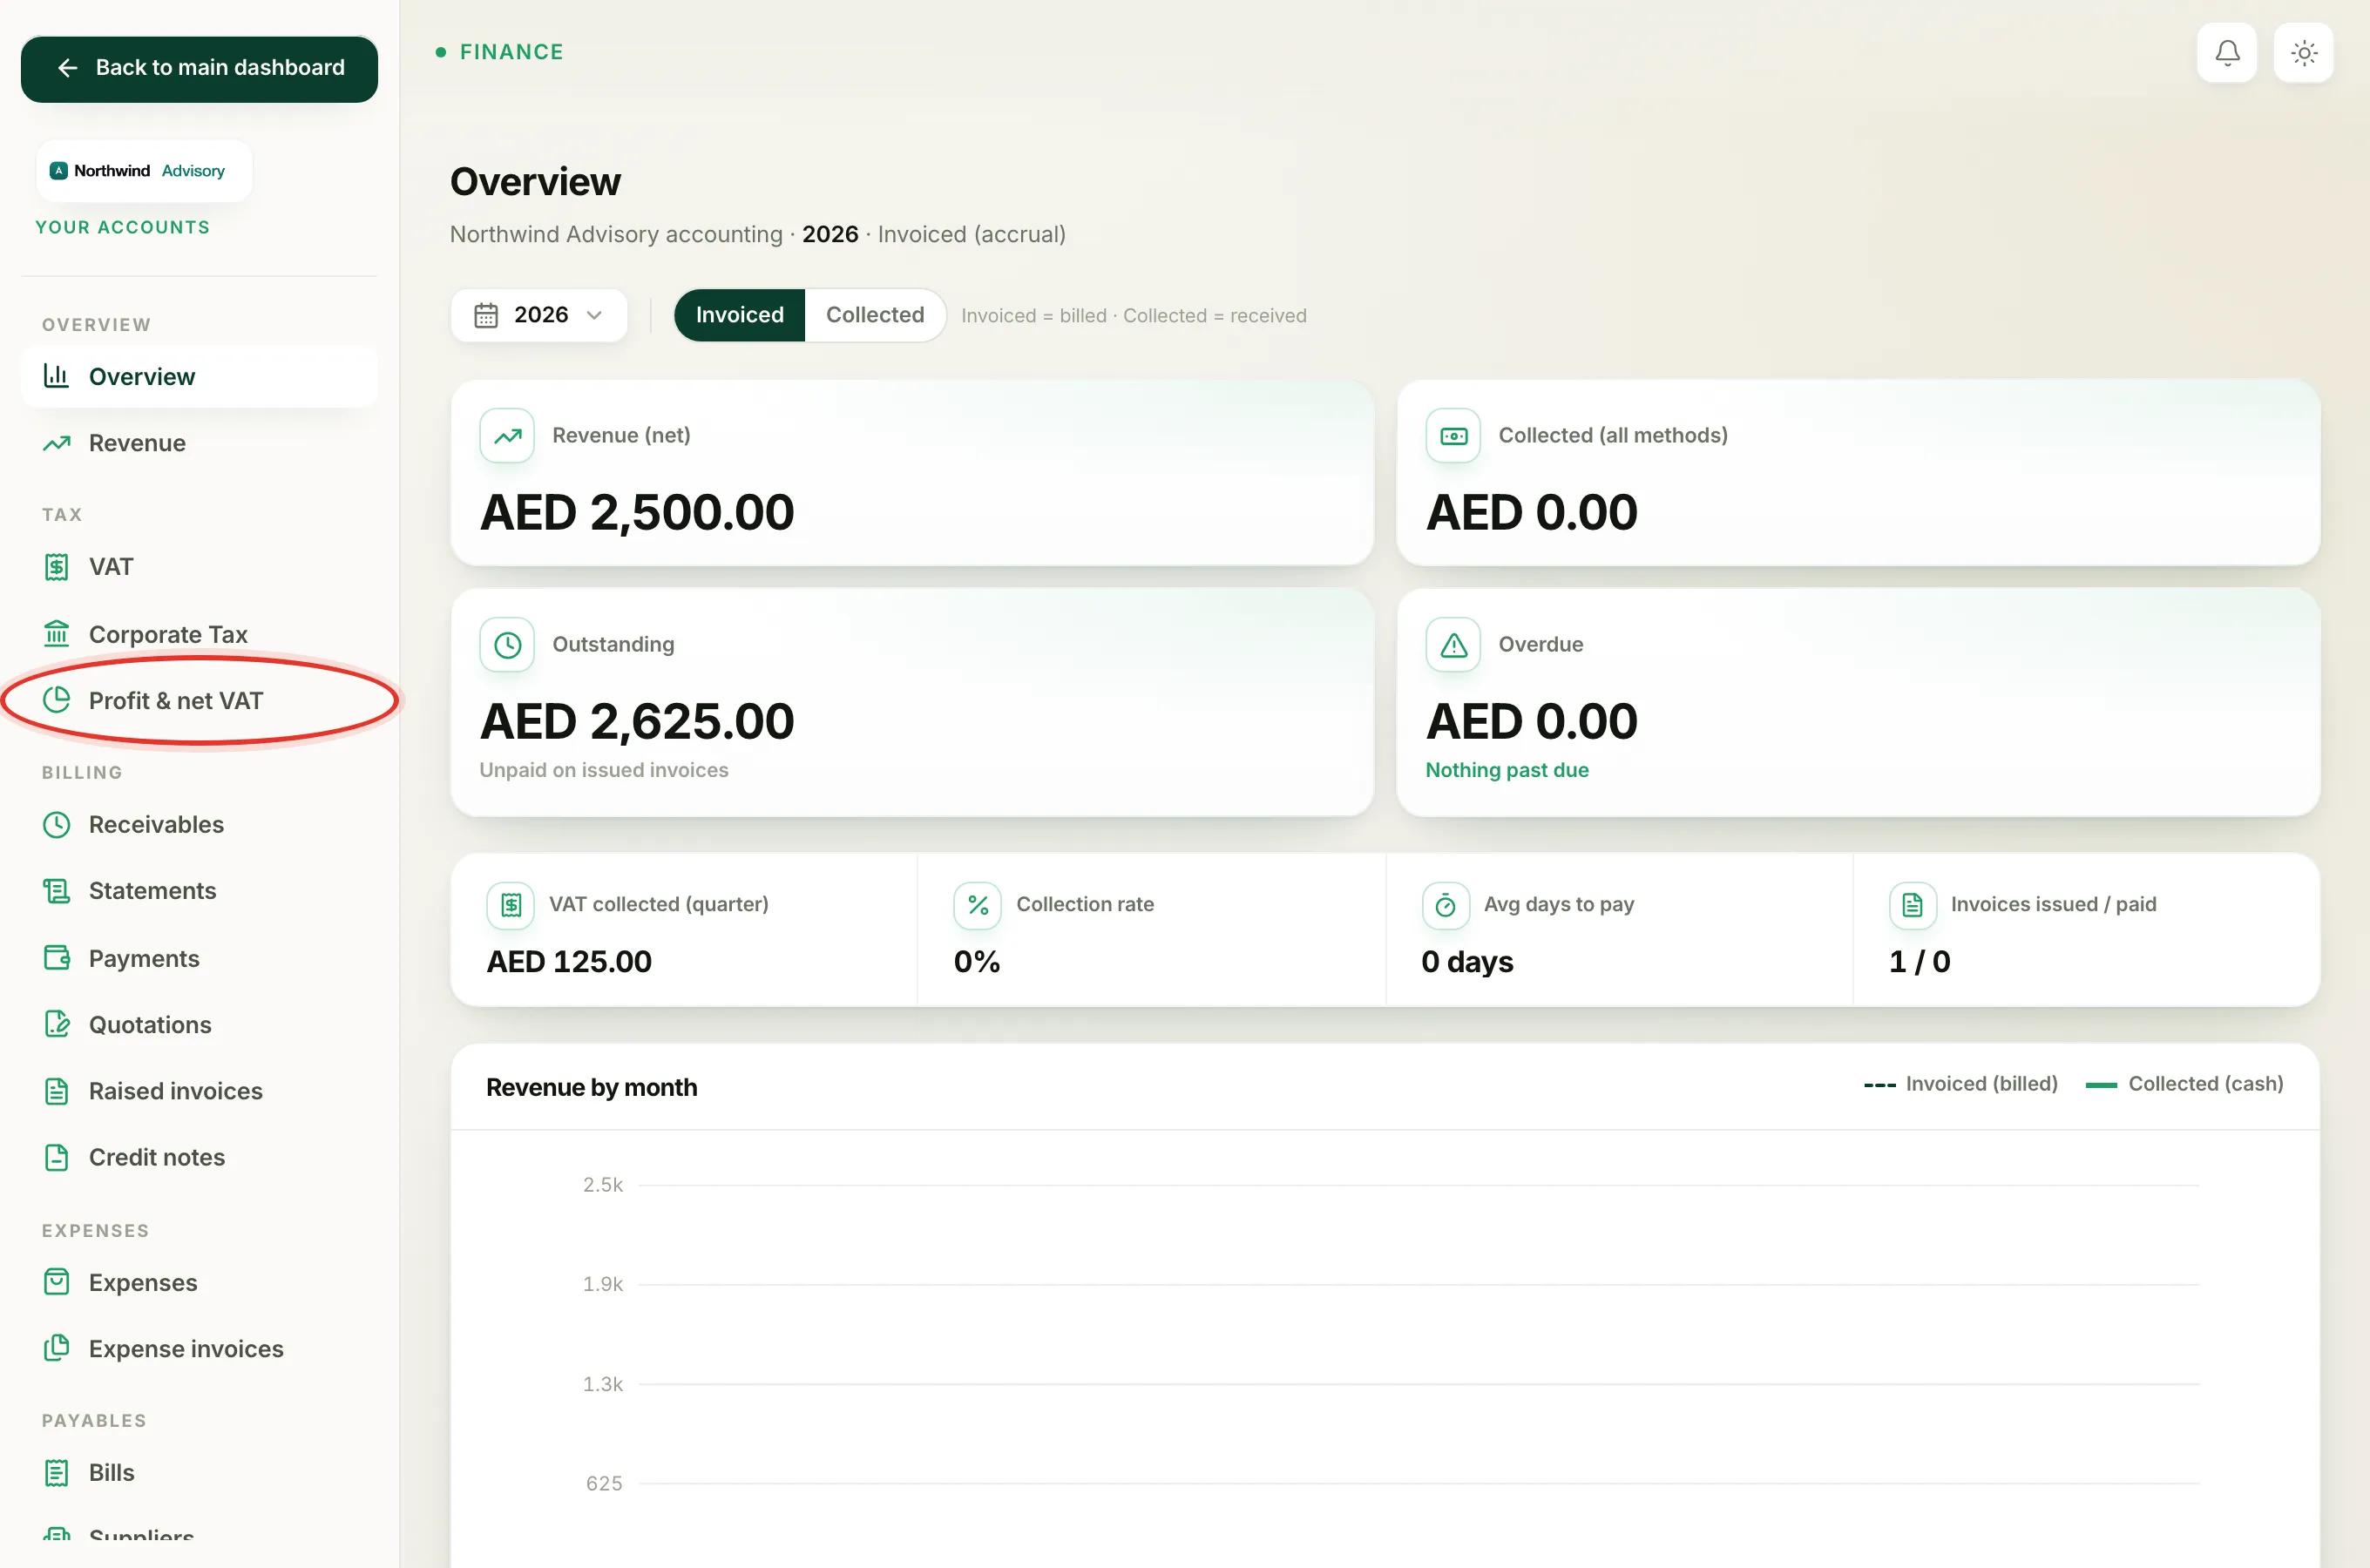
- Log in to your workspace.
- In the left menu, under Finance, click Your Accounts.
- In the accounting menu, under Tax, click Profit & net VAT.
Choose the period first
At the top of the page is a date range picker. It sets the period every number on the page is worked out for. The default is This year. Click it to switch to This month, Last month, This quarter, Last quarter, Last year, or Custom range to pick your own start and end dates.
Always set the period to match the VAT quarter or the stretch of time you want to look at before you read the numbers.
The four numbers at the top
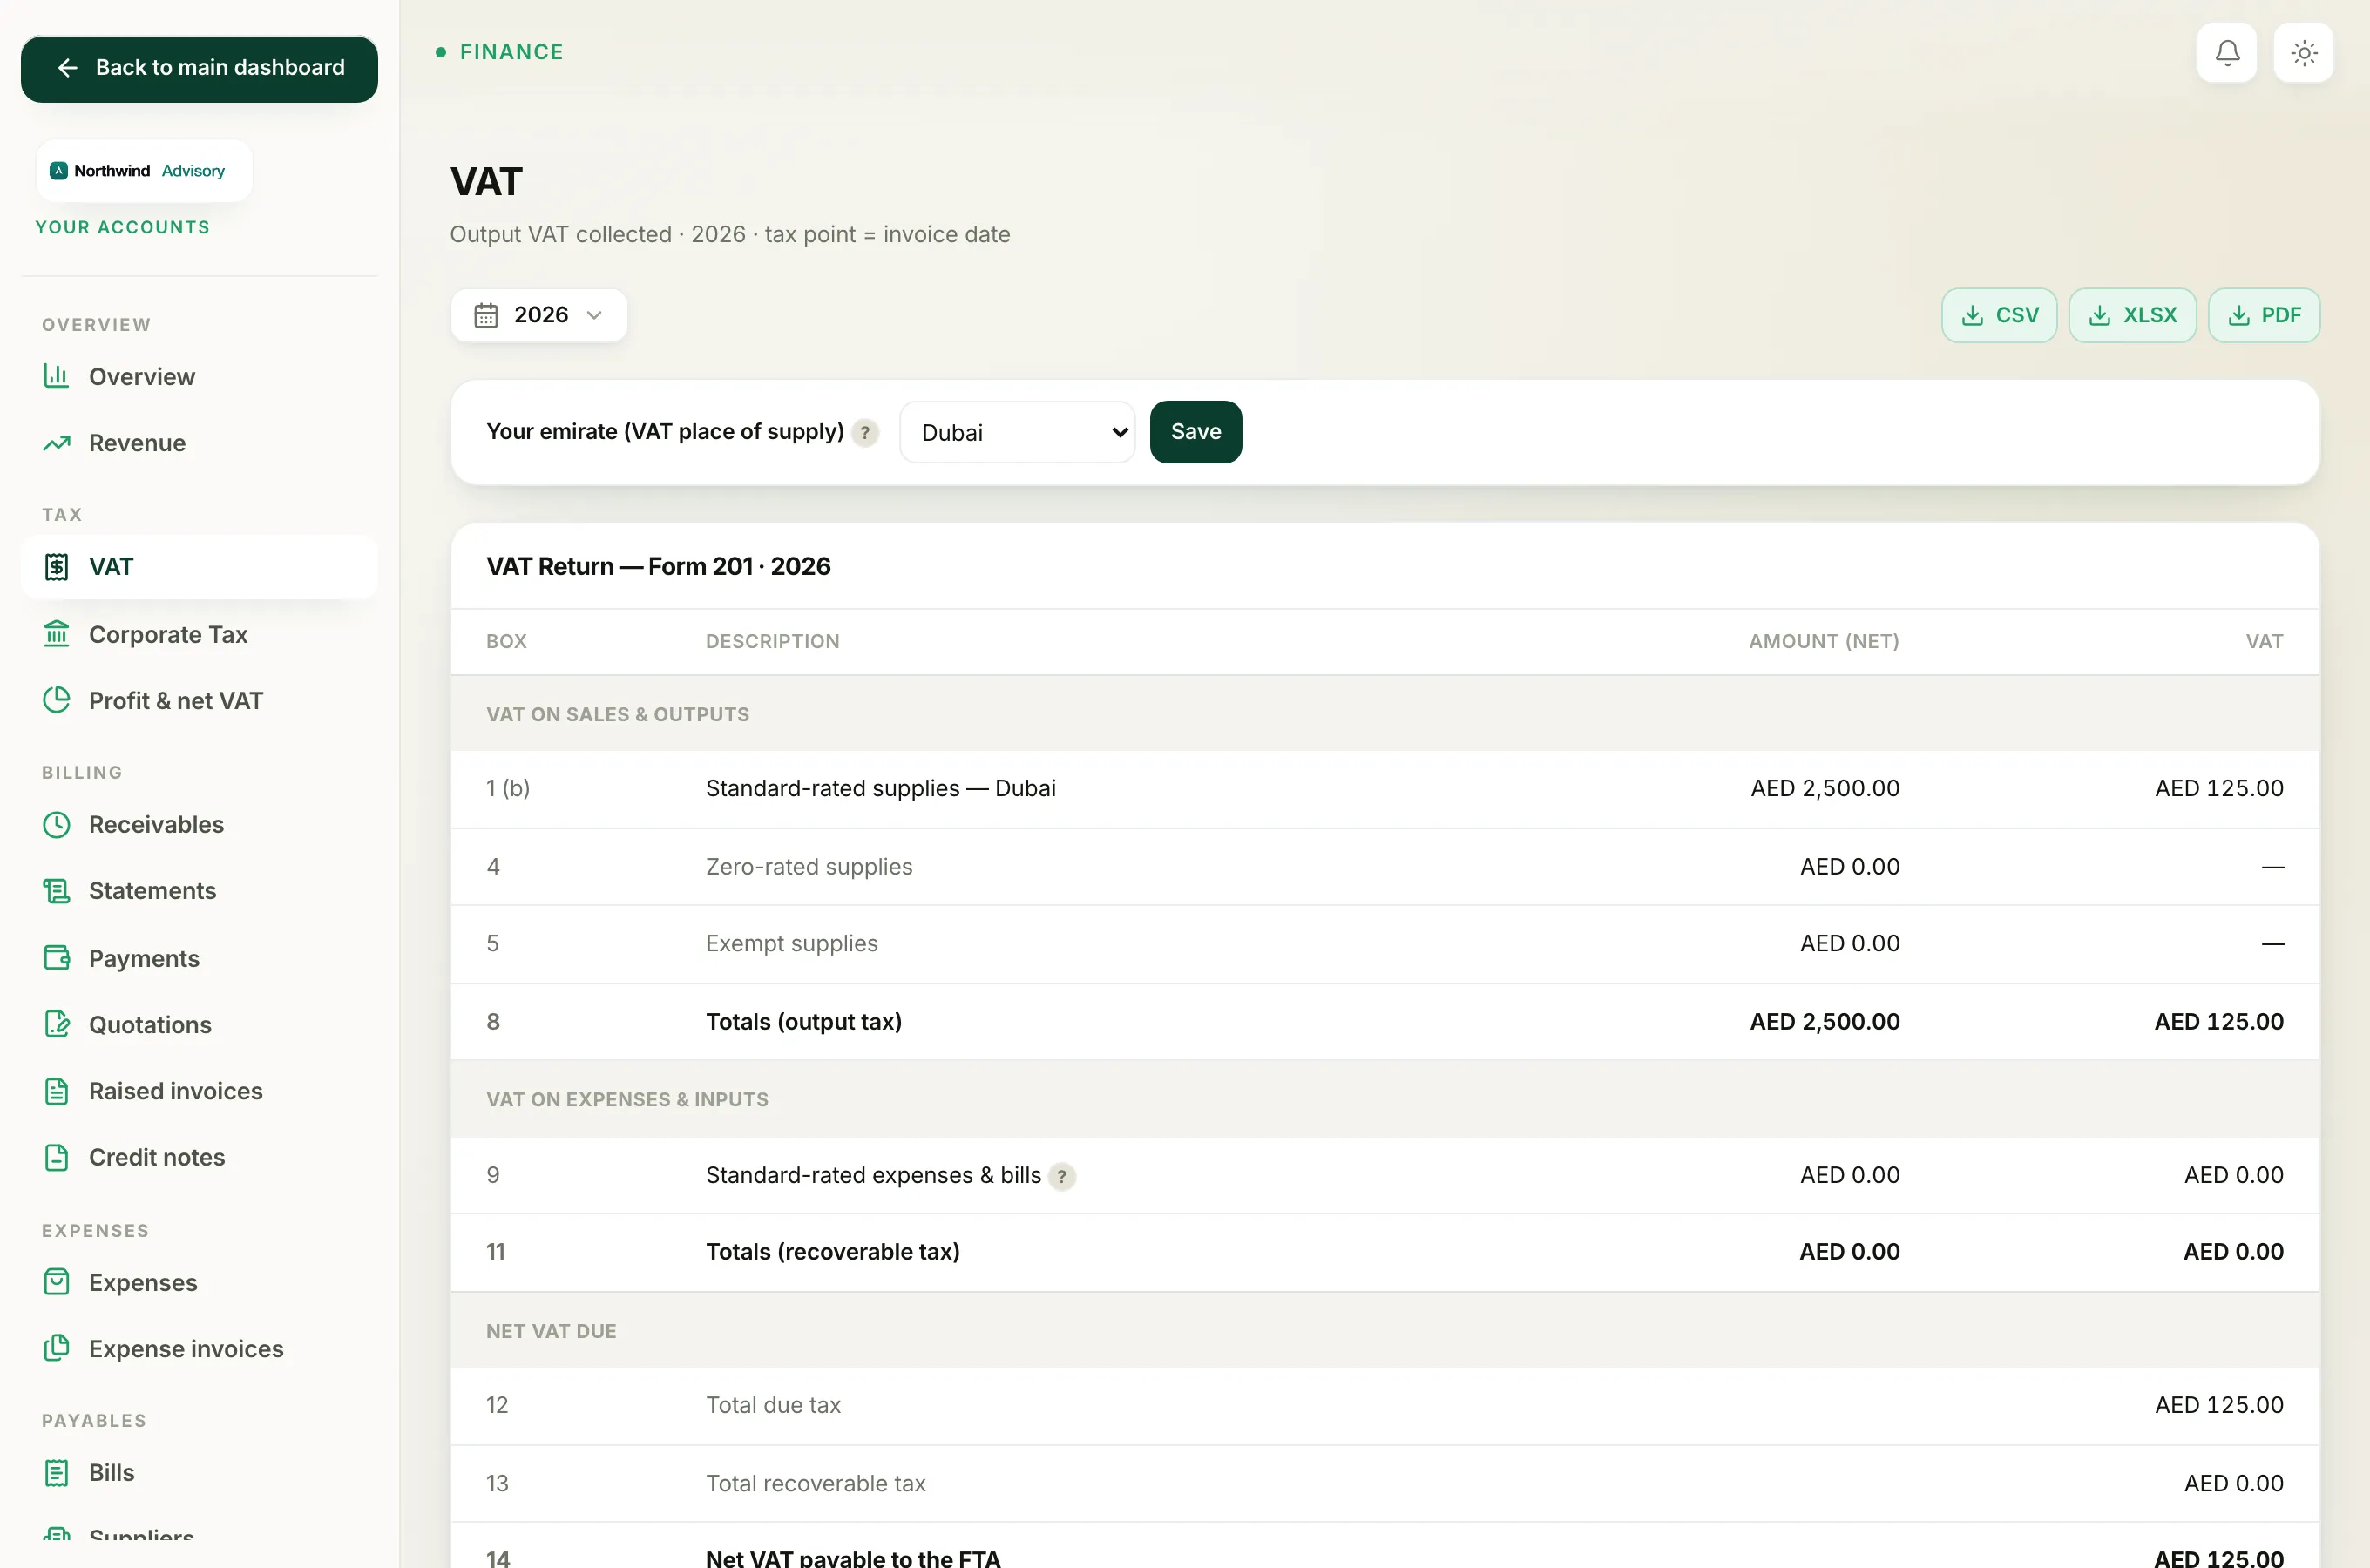
Across the top you will see four tiles.
- Output VAT (sales). The 5% VAT you charged your clients on the invoices you raised in this period. This is money you have collected on the FTA's behalf.
- Input VAT (reclaimable). The VAT on your own expenses and supplier bills that you are allowed to claim back.
- Net VAT payable. Output VAT minus reclaimable input VAT. This is the single figure you owe the FTA. If your reclaimable input VAT is larger than your output VAT, this number is negative, which means the FTA owes you a refund for the period.
- Profit. The service fees you have invoiced in the period, minus the cost of the expenses you recorded. This tells you whether the work you did actually made money.
Note
Profit here counts the fees for your own work, not the government fees you pass on to a client at cost. Those pass-through fees are not your revenue, so they are left out of the profit figure.
Revenue vs expenses chart
Below the tiles is a Revenue vs expenses chart. The green line is the money you invoiced and the red line is what you spent, plotted over the months (or quarters) in the period. When the green line sits well above the red one, you are comfortably profitable.
The two tables
Profit by period breaks the same figures down row by row, with a Period, Revenue, Expenses and Profit column, so you can see which months carried the period.
Expenses by category shows where your money went. Each row has the category, the Count of expenses, the Net spent, the VAT on it, and its Share of your total spend as a percentage.
Download the figures
At the top right of the filter bar are three buttons: CSV, XLSX and PDF. They export the report for the period you have chosen, for example to keep with your records or to send to your accountant.
File your VAT return
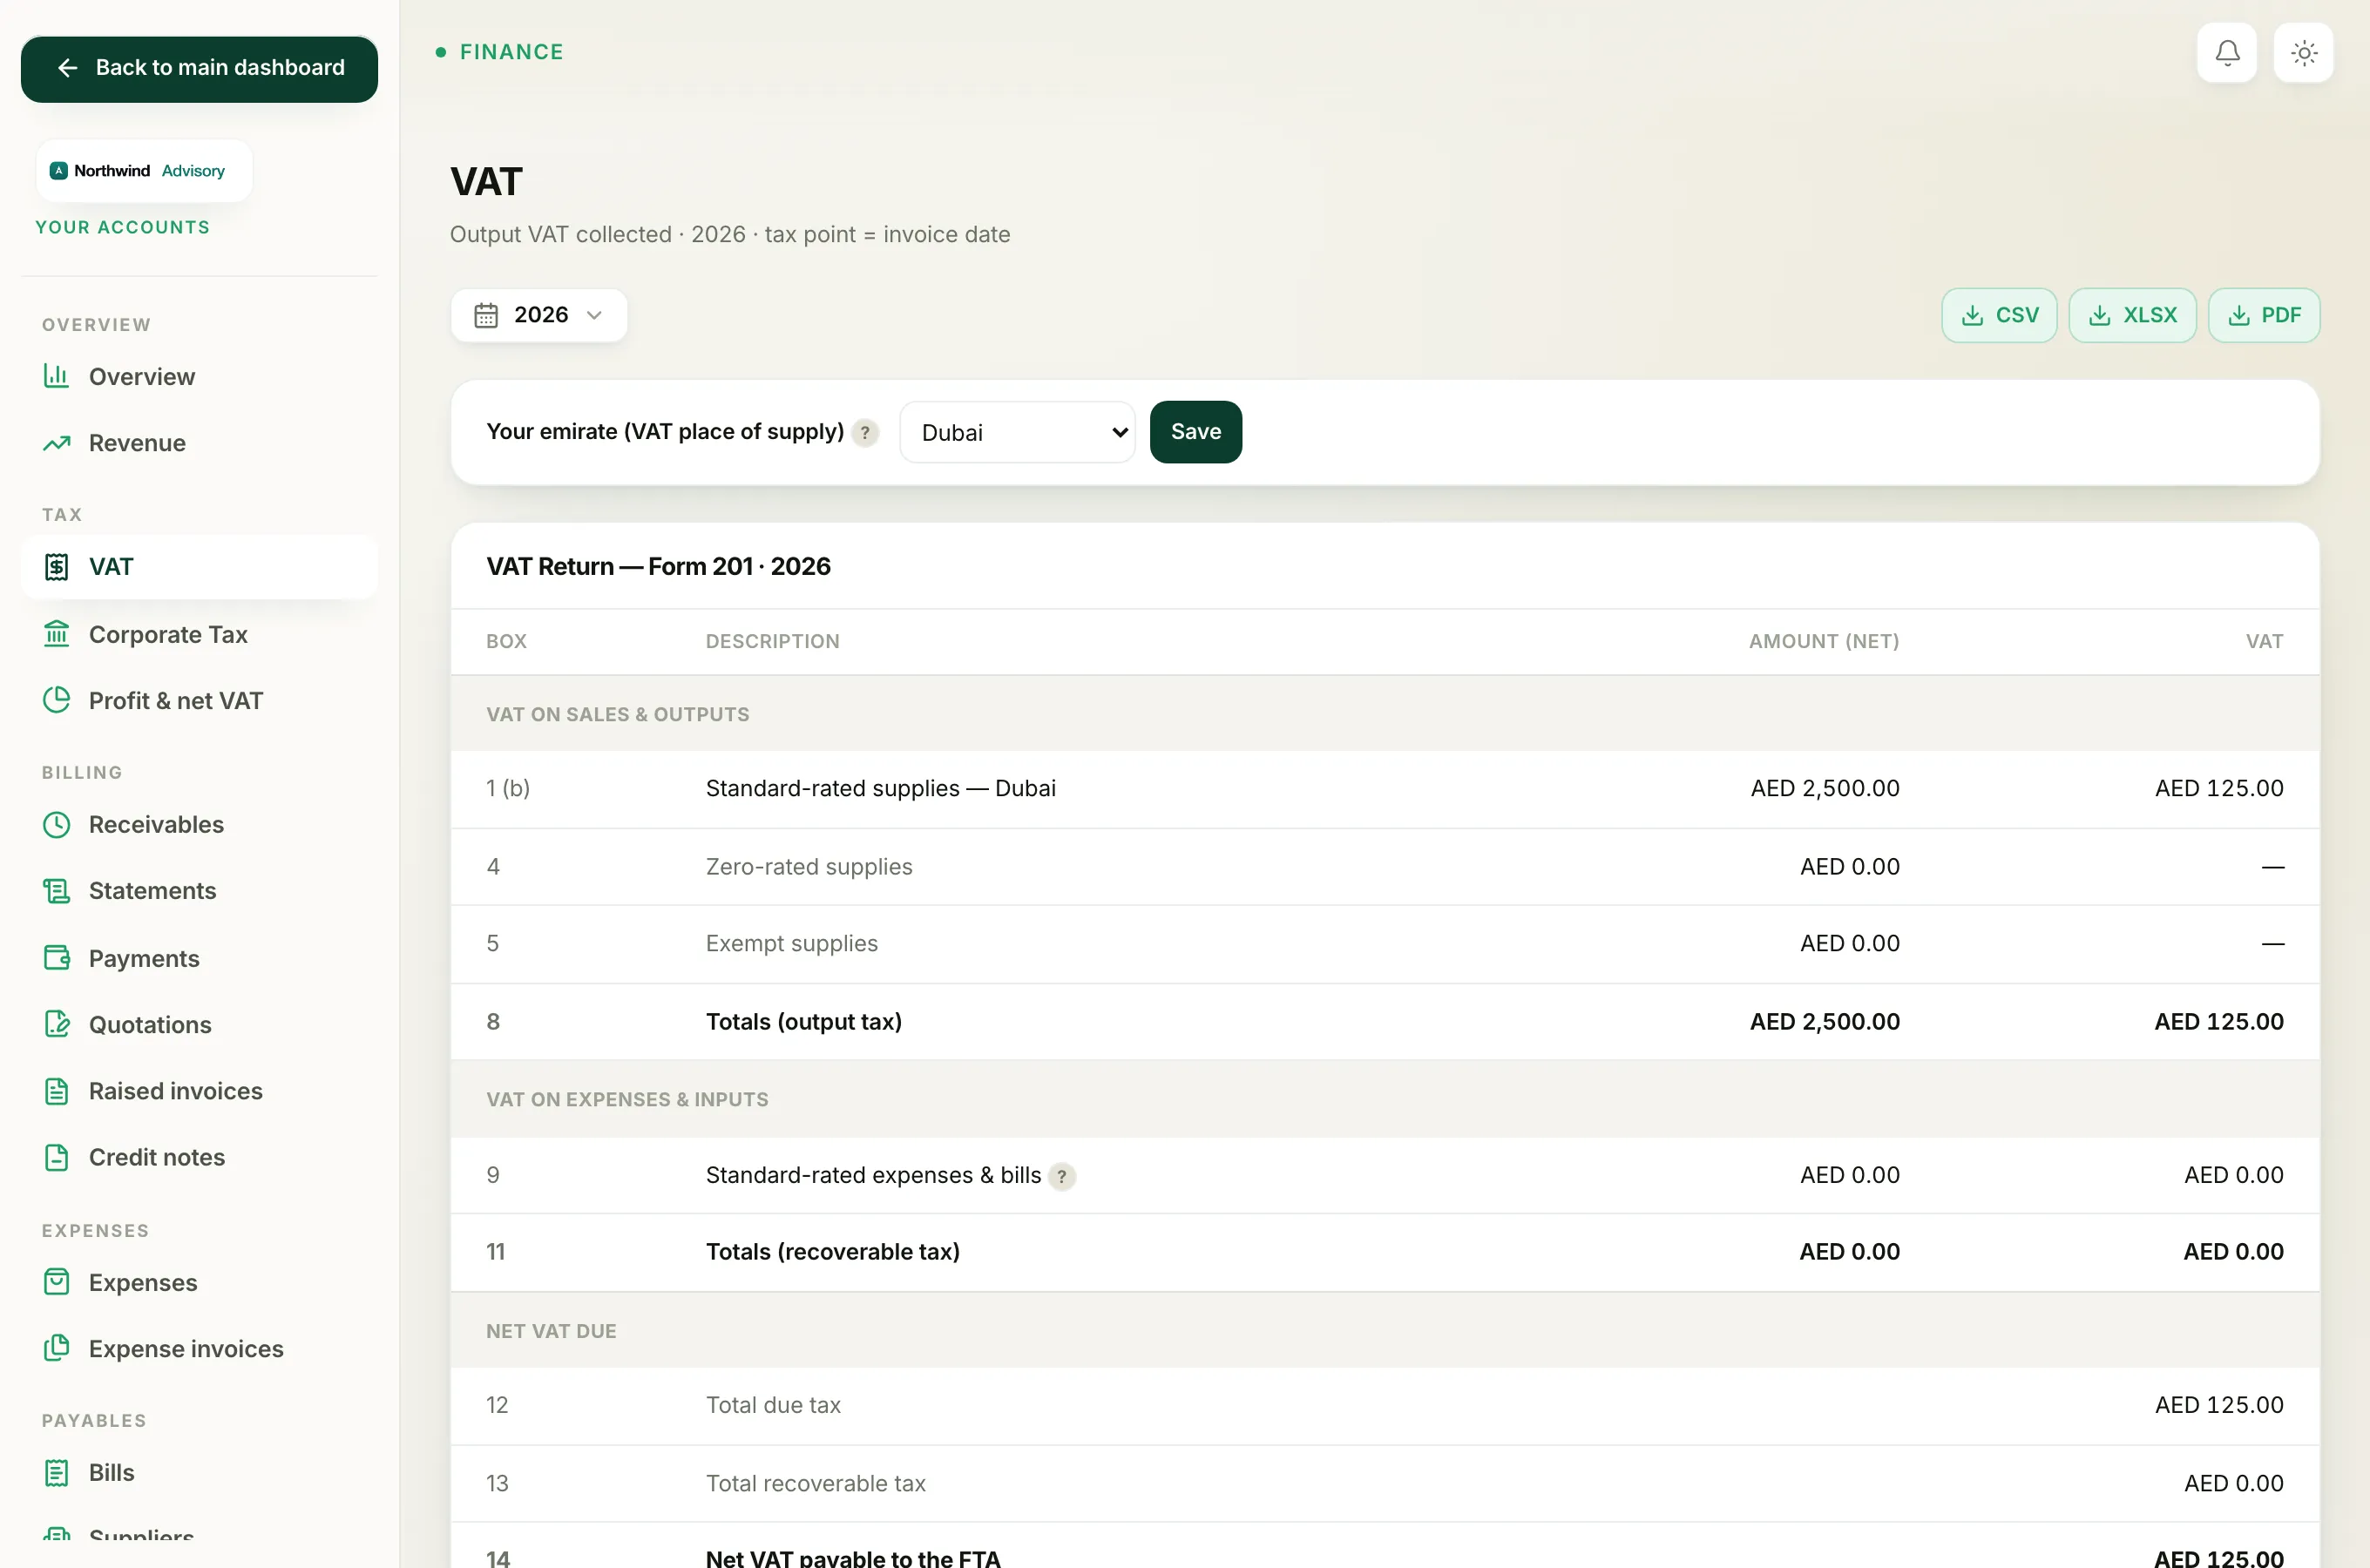
Further down the page is the FTA VAT Return, Form 201 panel. Click Download VAT 201 (PDF) to get the official return in the FTA's own layout, already filled in with the output VAT, input VAT and net VAT for the selected period. You then file it on the FTA portal. For the full walk-through, see prepare your VAT return.
To look at profit on its own in more depth, use your Profit and Loss report.